Exhibition ROI is the revenue an exhibition generated, minus what it cost, divided by what it cost: ROI = (Revenue − Total cost) ÷ Total cost × 100%. To measure it you need two things most exhibitors don't track: the true total cost of the event, and which sales actually came from its leads. Supporting metrics such as cost per lead and cost per customer help you compare events even before all the revenue has arrived.
Step 1: Add up the true total cost
Exhibitors often count only the stall space. The real cost is usually much higher. Include:
- Space rental and any organiser fees (power, Wi-Fi, listings, badge scanners).
- Stall design and build, furniture rental, graphics and lighting.
- Printed material and samples.
- Transport of products and stall materials.
- Travel, hotels and meals for the team.
- Staff time — the salaries of everyone working the stall and preparing for it.
- Marketing — pre-show invitations, ads and giveaways.
- Tools — lead capture apps, scanners, tablets.
If a stall build is reused across several events, divide its cost between them.
Step 2: Count what the exhibition produced
Track these numbers for every event:
| Metric | What it means |
|---|---|
| Visitors engaged | People who interacted with your stall |
| Contacts captured | Visitors whose details you collected |
| Qualified leads | Contacts that meet your qualifying criteria |
| Hot leads | Contacts ready for a sales conversation now |
| Opportunities | Quotes, proposals or meetings created |
| Customers | Leads that placed an order |
| Revenue | Value of orders from those customers |
You can only fill in the bottom three rows if each lead is tagged with the event it came from and its outcome is recorded. This is the biggest practical obstacle to measuring exhibition ROI.
Step 3: Calculate the key metrics
- Cost per lead = Total cost ÷ Qualified leads
- Lead-to-customer rate = Customers ÷ Qualified leads × 100%
- Cost per customer = Total cost ÷ Customers
- ROI = (Revenue − Total cost) ÷ Total cost × 100%
If your products sell repeatedly, also consider the value of a customer over a year or more, not just the first order.
A worked example
This example uses invented round numbers to show the calculation — it is not a benchmark.
A manufacturer exhibits at a three-day trade show:
| Cost item | Amount (₹) |
|---|---|
| Space rental and fees | 1,50,000 |
| Stall design and build | 1,00,000 |
| Travel, stay and meals for 4 people | 80,000 |
| Staff time | 60,000 |
| Printing, samples and giveaways | 40,000 |
| Transport | 30,000 |
| Lead capture tool | 10,000 |
| Total cost | 4,70,000 |
Results tracked over the next four months:
- Contacts captured: 400
- Qualified leads: 120
- Customers: 9
- Revenue from those customers: ₹14,10,000
Calculations:
- Cost per qualified lead = 4,70,000 ÷ 120 ≈ ₹3,917
- Lead-to-customer rate = 9 ÷ 120 = 7.5%
- Cost per customer = 4,70,000 ÷ 9 ≈ ₹52,222
- ROI = (14,10,000 − 4,70,000) ÷ 4,70,000 × 100% = 200%
Now compare: if another exhibition costs similar money but produces only three customers, its ROI is far lower — even if its stall felt busier.
Use a break-even target before the show
Before committing to an exhibition, estimate how many customers you need just to cover its cost:
Break-even customers = Total cost ÷ Average gross profit per customer
Then use your typical lead-to-customer rate to estimate how many qualified leads that requires. This gives your stall team a concrete target, and tells you early if an event is unrealistic.
Measure over the right time window
B2B purchases often take weeks or months after an exhibition. Measuring revenue a week after the show will make almost every exhibition look like a failure. Review your numbers at 30 days, 90 days and around six months, and keep updating each lead's status as deals close.
Look beyond revenue — honestly
Some benefits are real but harder to count: meeting existing customers, finding distributors, launching a product, or learning about competitors. Record them, but don't use them to justify an event that consistently produces no business. Set targets for them too, such as "meet 10 existing distributors".
The data you need to capture to make this possible
- A lead record for every contact, not a pile of cards.
- The event each lead came from.
- A qualification level, such as hot, warm or cold.
- A status that is updated as the lead progresses — for example New, Contacted, Converted, Lost.
- Revenue for converted leads, recorded in your sales system.
If you capture the first four at the stall and during follow-up, calculating ROI becomes a short exercise instead of a guess. Our exhibition lead management guide explains how to set this up end to end.
Measuring exhibitions with StallLead
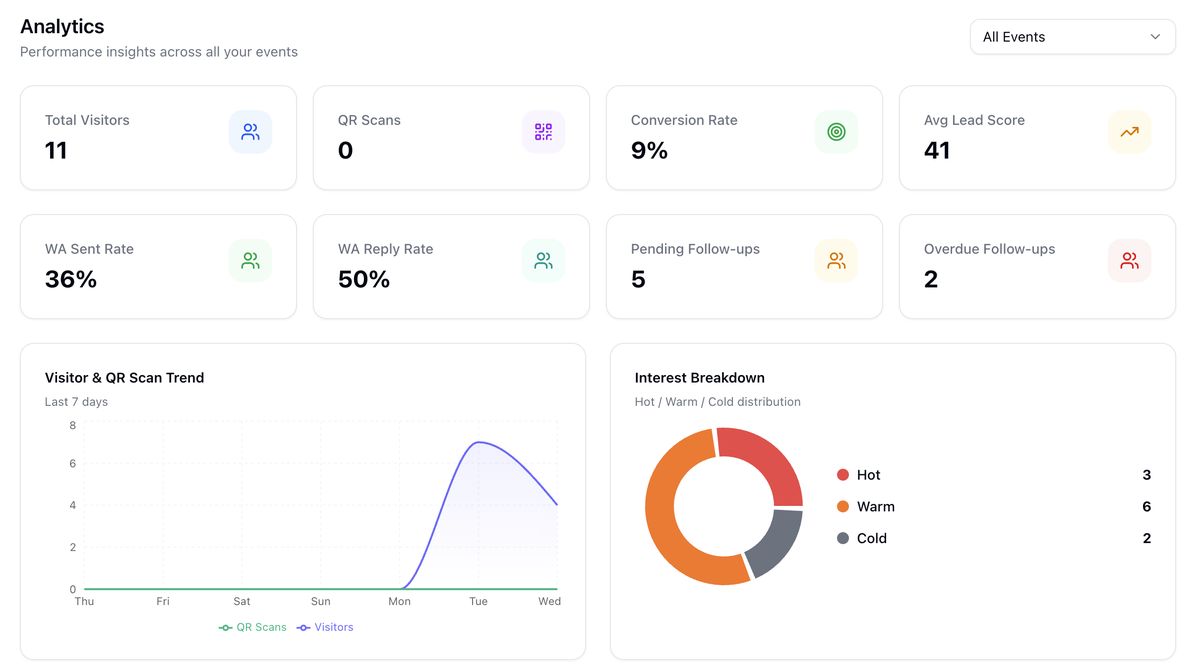
StallLead records every lead against the event it came from, with its interest level and status. Analytics show visitors, QR scans, conversion rate, follow-ups and the hot, warm and cold breakdown — for one event or across all of them — and leads can be exported to Excel to combine with revenue data from your accounting or CRM system. Book a free demo.
Frequently asked questions
How do you calculate exhibition ROI?
ROI = (Revenue from exhibition leads − Total exhibition cost) ÷ Total exhibition cost × 100%. Include all costs — space, stall build, travel, staff time, printing and tools — and only revenue from customers who came from that event's leads.
What is a good cost per lead for a trade show?
It depends heavily on your industry, deal size and the event, so compare against your own numbers: the cost per lead of your other exhibitions and of other channels such as online ads. A high cost per lead can still be worthwhile if the leads convert into large orders.
How long after an exhibition should I measure ROI?
Measure at 30 days, 90 days and around six months, because many B2B sales close weeks or months after the event.
What should I track at an exhibition to measure ROI?
Track every contact as a lead, tag it with the event, record a qualification level and a status, and record revenue when the lead converts. Also keep a full list of the event's costs.